Own product · dose-response & drug synergy
Why I built synfit
In academia I kept watching wet-lab colleagues fight their dose-response software: an early-2000s interface, plots from even earlier, and uncertainties treated as an afterthought, if at all. I know of at least two cases where that cost a team months, chasing a direction the data never supported. synfit is my answer: curve fits with honest uncertainties, in the browser or in Python.
A number without an interval is an invitation
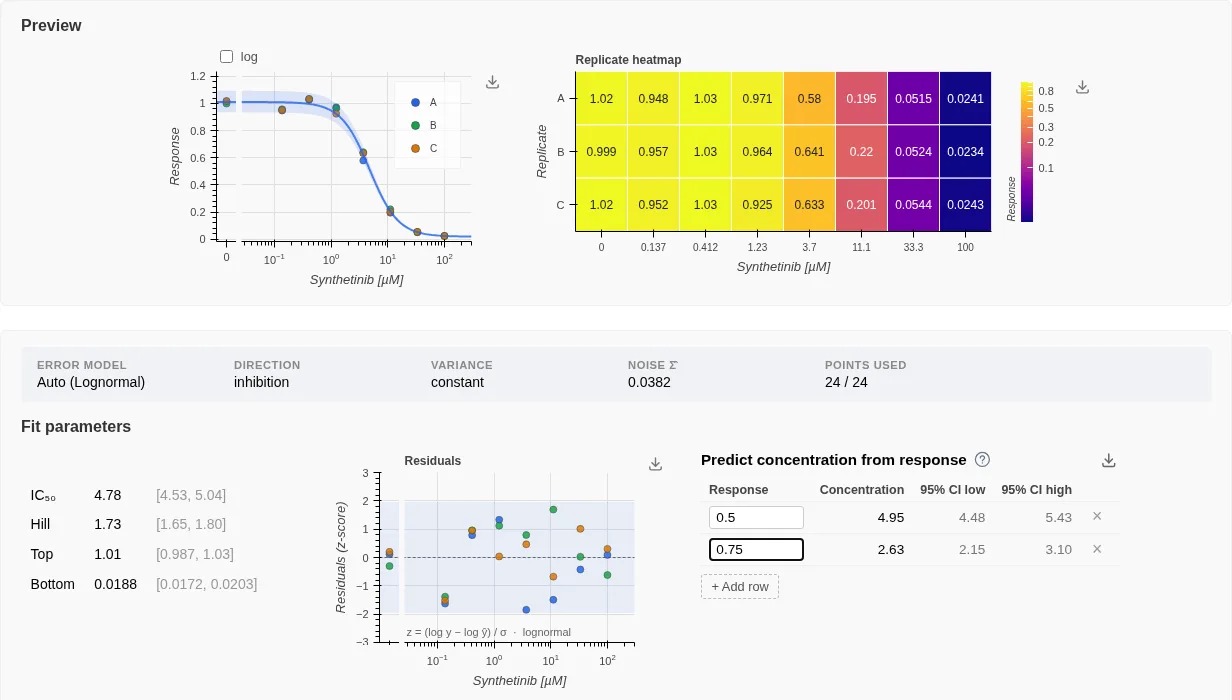
An IC50 of 4.8 µM sounds like a fact. Whether the data support 4.5–5.0 or 1–20 changes what you do next, and a point estimate doesn’t tell you which. synfit reports a 95% confidence interval on every fitted parameter and shows the residuals, so you can check the fit rather than admire it. Iteration is fast: click a point to exclude it, and the refit appears straight away.
Least squares assumes the wrong noise
Plain least squares treats every point as equally noisy. In most assays the noise grows with the signal, so the loudest points steer the fit and the reported uncertainty comes out too small. synfit models the noise as well, and if you’re unsure which noise model applies, it fits the candidates and keeps the one the data support best.
Four definitions of synergy, and they disagree
Calling a combination synergistic means comparing it with what “no interaction” would look like, and there are several reasonable definitions of that: Bliss, Loewe, HSA and ZIP. On the same plate they can tell different stories. synfit fits both drugs jointly and lays the four maps side by side, so you see where they agree before “synergy” goes into a paper.
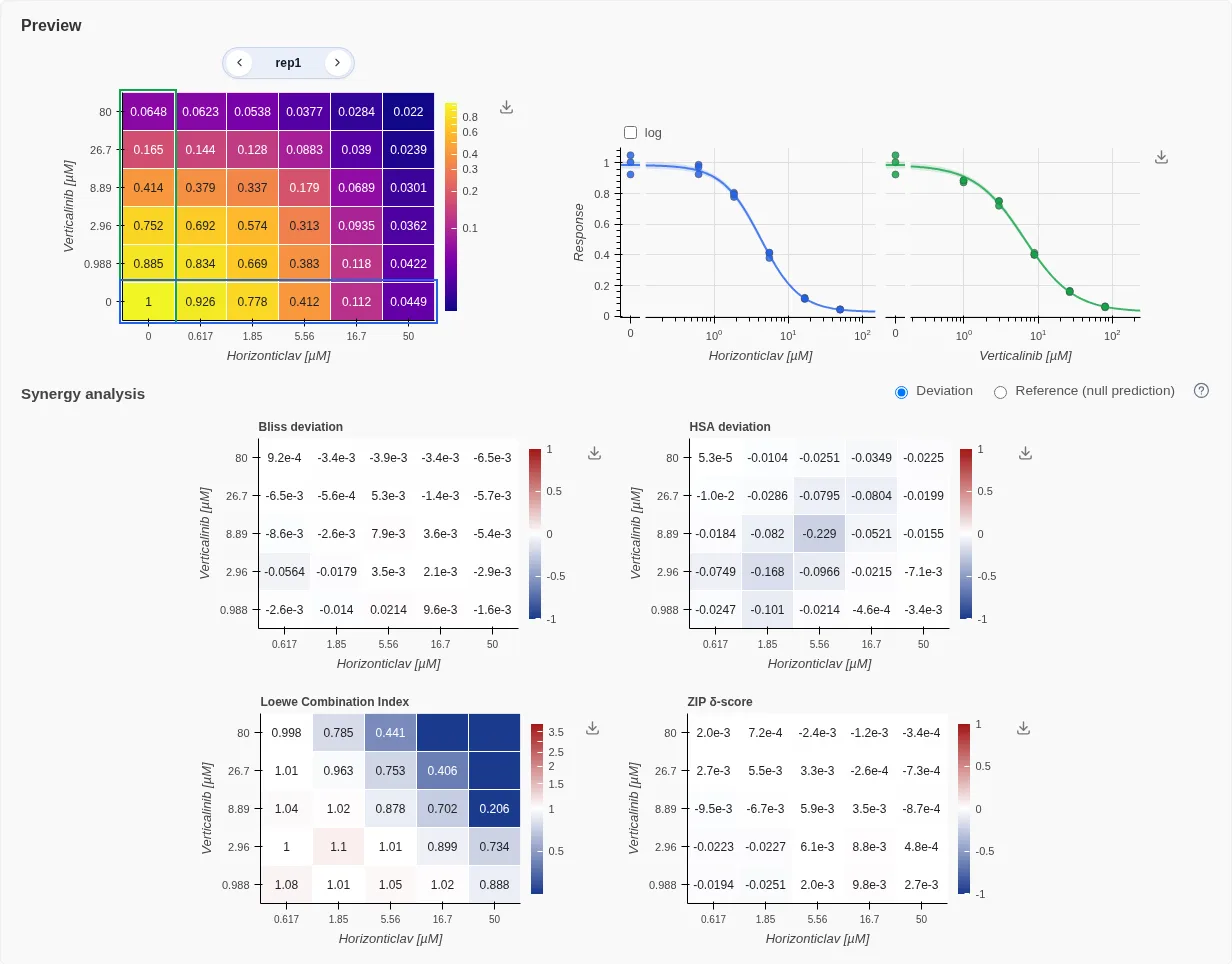
What each score computes, and what it assumes, is laid out in synfit’s help pages, open to anyone without signing up.
A fitted curve as a shareable calculator
A standard curve is often fitted once and then reused for a while, sometimes by people who didn’t fit it, through a spreadsheet that can drift away from the original. In synfit, you fit the curve once and share a read-only link. Anyone with the link can back-infer concentrations from measured responses, with confidence intervals, from the same fitted model. No re-fitting, no spreadsheet drift, no signup for the viewer, and you can revoke the link at any time.
The maths is open. Check it.
The numerical core is a Python package, MIT-licensed, on PyPI. It ships a set of synthetic datasets with known ground truth, among them a drug combined with itself, where the right answer is known exactly. So you can test whether a fit recovers what went in instead of taking my word for it. Every analysis in the app records which library version produced it, and the help pages document each method: noise models, confidence intervals, synergy references.
pip install synfitWhy it took years, and then didn’t
I wanted to build this for years. Every earlier attempt stalled at “fitting library plus matplotlib”: the maths was the easy part, and the interface people would actually use was the part I never had time for. AI coding tools changed that arithmetic. The full version, with the app, the plots and the sharing, became something I could build in evenings rather than quarters. What didn’t change is the part that needs judgment: which statistics fit the lab’s data, what to show a biologist and what to leave out.
Try it
synfit.app has a demo with sample data and no signup. It’s in beta and meant for research use. I’d most like to hear where synfit disagrees with the tool you use now. Which is to say: where your tool is wrong.